

Intro To Data Analysis
A
An experienced Software engineer with extensive knowledge in Fullstack development ( Java - Angular 8+ ) and Data Science.
Search for a command to run...
An experienced Software engineer with extensive knowledge in Fullstack development ( Java - Angular 8+ ) and Data Science.
Hello Miklós Szeles, waiting for your feedback and hope you enjoy reading it.
In this series, I will try and tackle a few concepts and examples about Data Analysis, machine Learning and Back-end Development
A beginner's guide into the world of relational databases using SQL
Docker: Use Cases and Why Docker is Important Introduction Docker has become an essential tool for modern software development and deployment. It enables developers to package their applications and dependencies into portable containers, making it ea...
Using Spring Boot with Apache Kafka: Building Event-Driven Systems Event-driven architectures are becoming increasingly popular as organizations move towards more distributed and decoupled systems. Apache Kafka is a popular open-source distributed st...
Building Reactive Systems with Spring Boot: Leveraging Spring WebFlux and Reactor In today's fast-paced world, where responsiveness and scalability are critical factors, building reactive systems has become a necessity. Reactive systems are those tha...
State Machine Diagrams in Spring Boot: Usage and Implementation State machine diagrams are a powerful tool for modeling complex behavior in software systems. In Spring Boot, the State Machine Framework provides an easy way to implement state machine ...
SOLID Principles in Spring Boot: A Comprehensive Guide SOLID is an acronym for the 5 principles of object-oriented design that promote software maintainability, scalability, and readability. These principles were introduced by Robert C. Martin and ha...
Hello and welcome to the second blog in a series of blogs where we discuss topics like Data Analysis, AI, Machine Learning and much much more.
This is the continuation in which we start by talking about Data Analysis. Don't worry we are still keeping things simple and will not introduce coding examples just yet.
As we have discussed in our previous blog, Data analysis is the process of cleaning, transforming, and modeling data to discover useful information that will help us make informed business decisions.
Data Analysis is not a new concept it has been around since the 1940's. One of the most famous examples is Henry Ford started measuring the speed of assembly lines, Analytics started becoming more mainstream when computers became a crucial part of the decision making process and providing more insights, with the development of Big data & the cloud; Data Analysis has started evolving dramatically. It involved gathering data from various sources, searching for patterns & creating data insights that help making much more informed decisions.
Data Analaysis is deeply intertwined with a wide variety of statistical methods; you don't have to worry if you have no background in statistics, but going forward if you want to pursue a further career; you will need to familiarize yourself with it to better know how to handle various types of data. Almost all libraries and tools already support built-in methods to handle different types of data.
Statistics deals with:
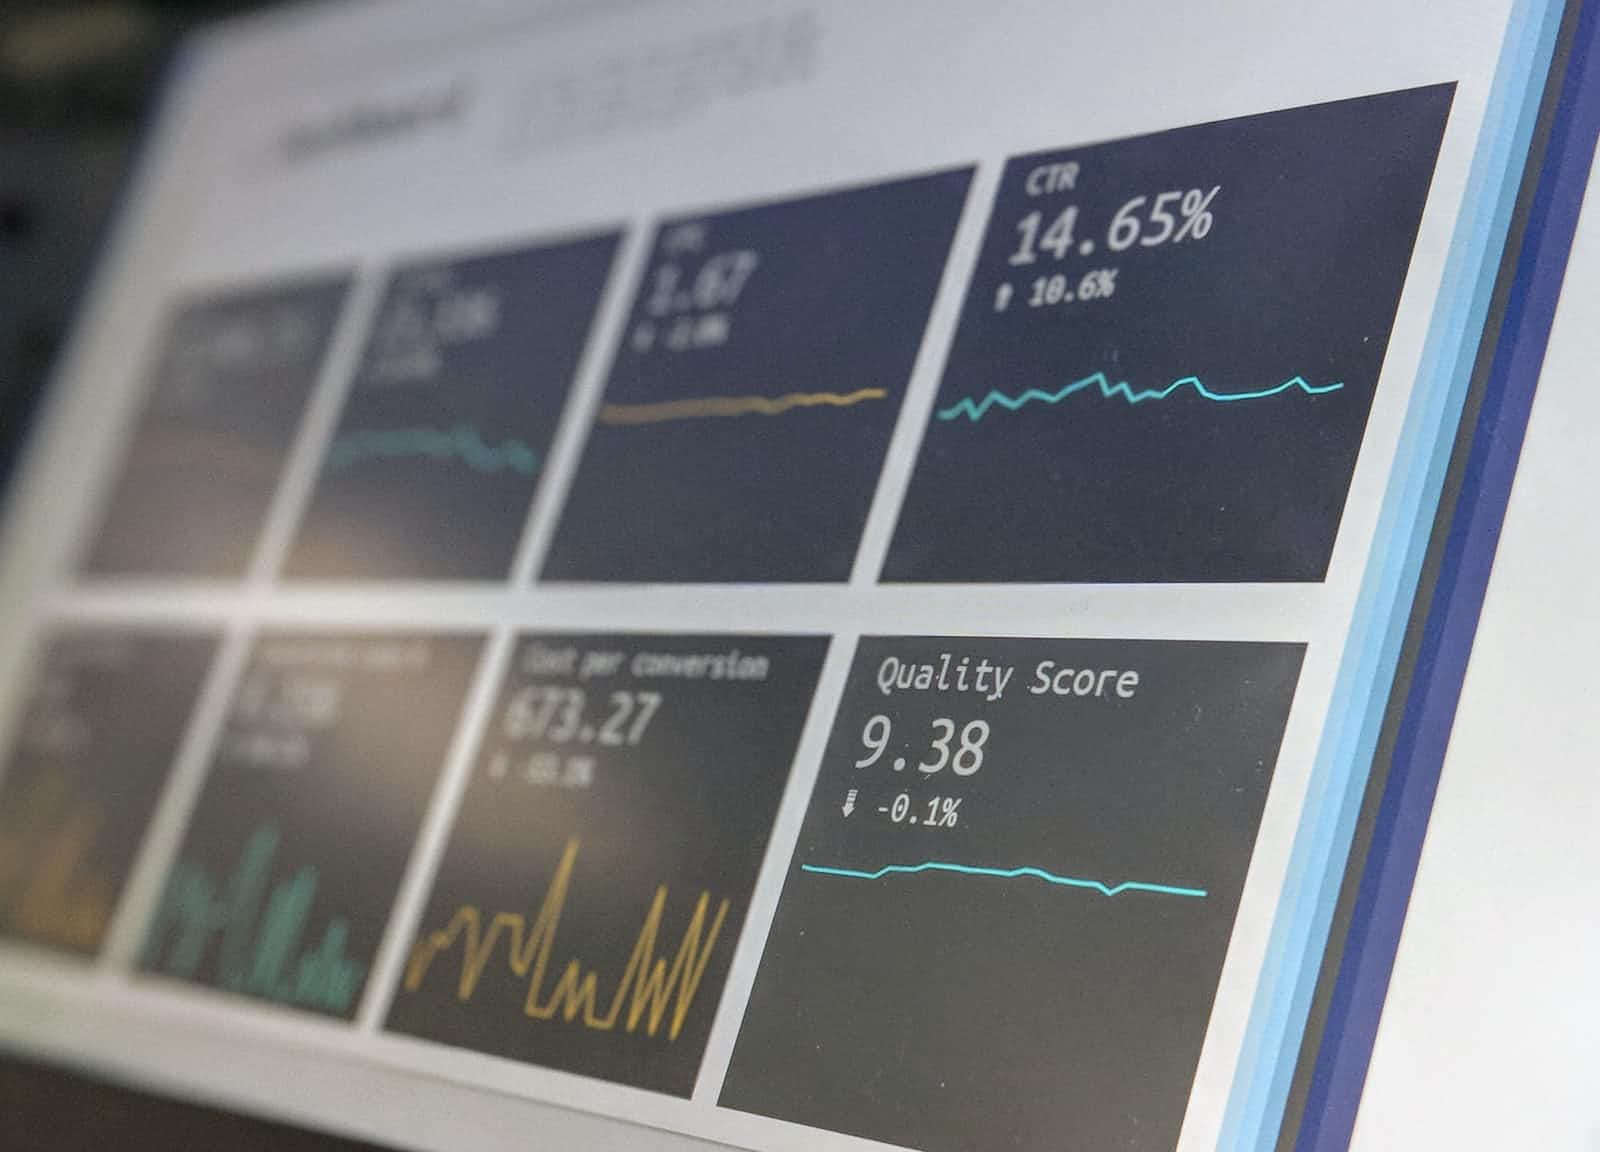
An example for how statistics helps is if we have a supermarket. Let's assume that we want to identify what are our clients most frequently purchase, we can analyze the invoices and group the items by their frequency and Voila! we know now the best and worst performing items.
Let's apply the supermarket example to what we are trying to explain in this section.
Gathering Hidden Insights: Analyzing customer's putchasing patterns.
Generating Reports: Getting the reports for how various items are performing to make better decisions by the management/decision makers for restocking or changing brands.
Market Analysis: Understanding the points of strength and weaknesses against our competitors and what is our store's edge.
The Data Analysis process consists of Five Iterational steps:
Identify What is the business requirement that we are trying to solve or what is the obstacle currently facing us?
Collect the raw data that we will need to help answer the identified question. It can come from various sources as mentioned before and It can be like the sales invoices to our customers in the supermarket example.
Clean the data. This often involves removing duplicates, inconsistencies & standardizing the format, and dealing with white spaces and other syntax errors.
Analyze the data. By manipulating the data using various data analysis techniques and tools - That we will discuss in details later on -, you can begin to find trends & correlations that begin to tell a story about how our business is doing or how are our customers reacting to various changes.
Interpret the results of your analysis to see how well you answered your original question and what recommendations can you make based on the data.
R Programming: The leading tool for analytics, statistics & data modelling; It pre-installs all packages and runs on Unix, Windows & Mac OS.
Python: Python is an open-source language that is easy to learn. We will discuss it in further blogs so if you have no background don't worry. Python has numerous packages that can aid you in your Data Analytics journey like: Sci-Kit Learn, Numpy & Pandas.
Excel: One of the most famous Microsoft applications, It is mostly used for Internal sheets data & Comma separated files (CSV).
There are a plethora of tools when it comes to data analysis, some more advanced like:
But for someone still getting to know the world of data analysis, you have come a long way and learned some of the basics that pave your way to start your own journey.
In the upcoming blog posts, we will dig deeper into SQL, Python & R and Implementing a small project to get our coding & data analysis journey started!
Hope you enjoyed reading this blog as much as I enjoyed writing it. If you have any comments or suggestions please feel free to reach out ❤